How to turn OpenStreetMap data into an isometric pixel-art city (with code)
Render real streets and buildings from OpenStreetMap as a SimCity-style isometric scene: data, projection, shading, draw order, night lights, pixel finish.
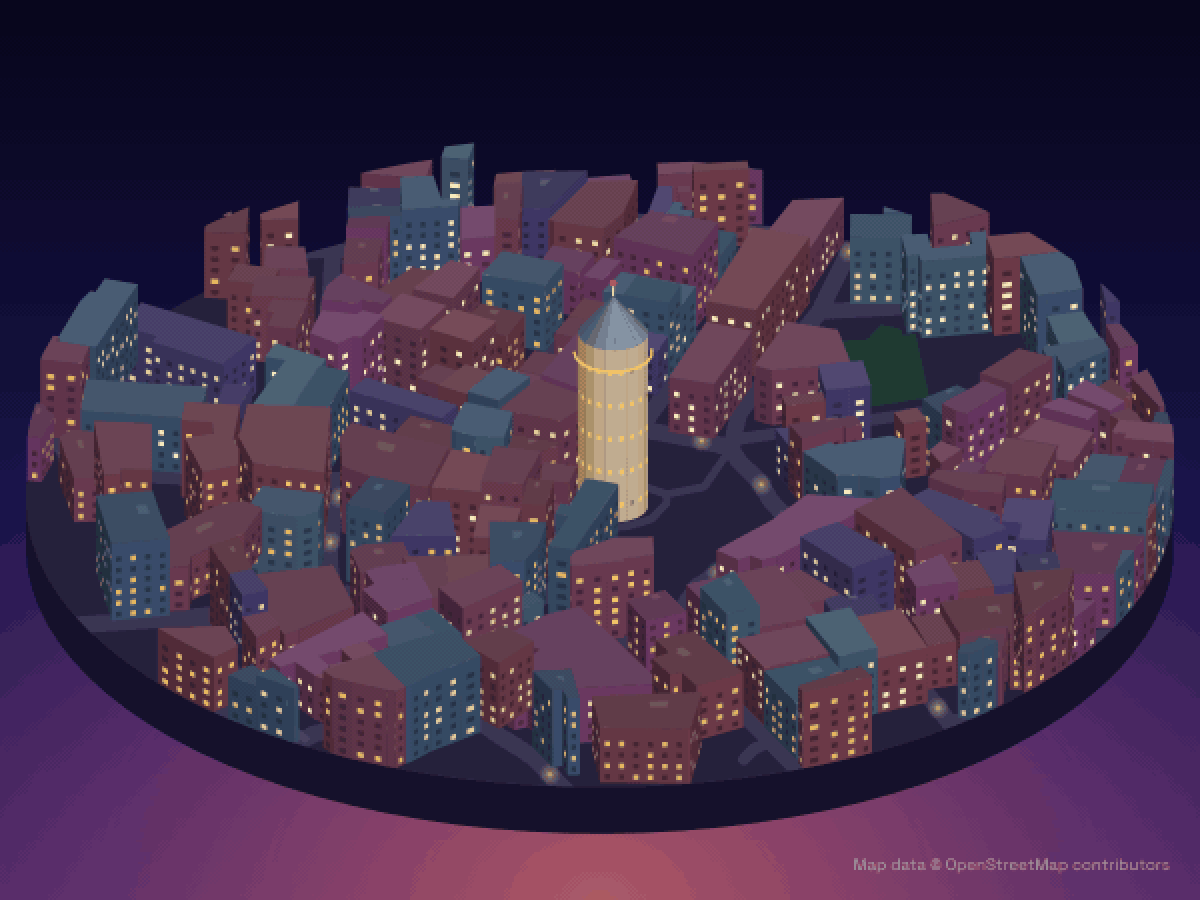
Most isometric city maps in our directory are AI-drawn: an image model turns aerial photos into pixel-art tiles. There’s a second technique that needs no model, no GPU and no API key: draw the city straight from OpenStreetMap data. That’s how we made the Galata Tower scene above, as well as our renders of the Empire State Building, Big Ben and Warsaw’s Palace of Culture.
This post walks through the whole pipeline in JavaScript, with the real code (trimmed for readability) and the problems we hit along the way.
What you need: Node.js, an SVG rasteriser (we use resvg), and optionally ffmpeg for the pixel-art finish and video. No map library is needed: the projection is about ten lines of maths.
1. Download buildings, streets and parks
OpenStreetMap data is easiest to fetch with the Overpass API. This query asks for every building, building part, street and park within 230 m of Galata Tower, with their geometry:
const [lat, lon, r] = [41.02562, 28.97417, 230];
const query = `[out:json][timeout:90];(
  way["building"](around:${r},${lat},${lon});
  way["building:part"](around:${r},${lat},${lon});
  way["highway"](around:${r},${lat},${lon});
  way["leisure"~"park|garden|pitch"](around:${r},${lat},${lon});
);out geom tags;`;

const res = await fetch('https://overpass-api.de/api/interpreter', {
  method: 'POST',
  body: new URLSearchParams({ data: query }),
});
const osm = await res.json(); // { elements: [{ type, id, tags, geometry: [{lat, lon}, …] }, …] }
Cache the result on disk. Overpass is a free, shared service: send a descriptive User-Agent, and don’t hammer it while you iterate on the rendering.
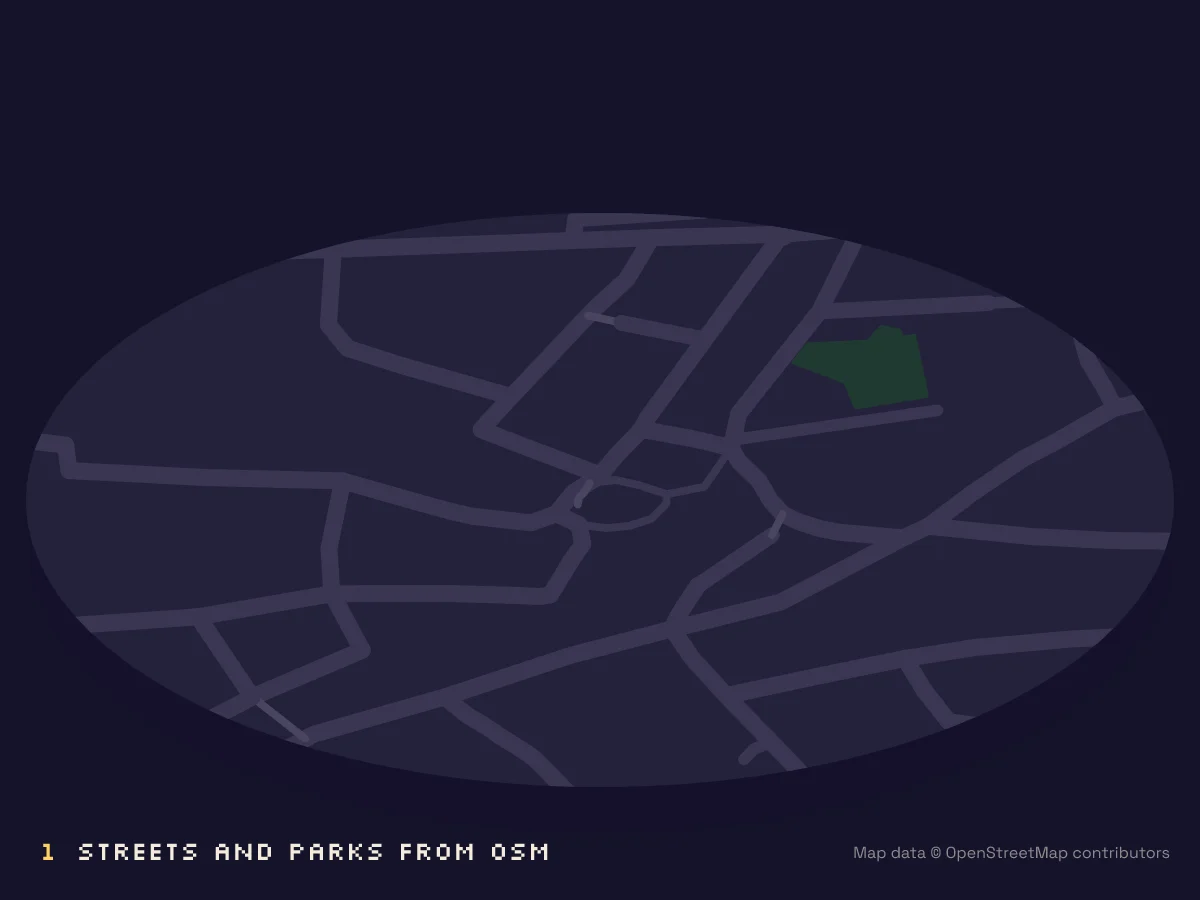
2. Convert latitude/longitude to metres
For a few hundred metres, a flat “equirectangular” approximation around the centre point is accurate enough:
const mPerLon = Math.cos((lat0 * Math.PI) / 180) * 111320; // metres per degree of longitude here
const mPerLat = 110540;                                     // metres per degree of latitude
const toXY = ({ lat, lon }) => [(lon - lon0) * mPerLon, -(lat - lat0) * mPerLat]; // x east, y south
From here on, every footprint is a polygon in metres.
3. The isometric projection
Pixel-art “isometric” is almost always 2:1 dimetric: lines step two pixels across for every pixel down (about 26.6° instead of true isometric’s 30°), which gives clean stair-step edges. As a function from ground coordinates (u, v) and height z to screen pixels:
const K = 2.9; // pixels per metre
const project = (u, v, z = 0) => [
  originX + (u - v) * K,
  originY + ((u + v) * K) / 2 - z * K,
];
To orbit the camera, rotate (x, y) by an angle before projecting. That’s how our videos spin around a landmark.
4. Extrude footprints into blocks
Every building becomes a prism: its footprint at z = 0 and again at its height. OSM gives you the height in one of three ways, and you’ll need fallbacks:
function heightOf(tags) {
  if (tags.height) return parseFloat(tags.height) - (parseFloat(tags['roof:height']) || 0);
  if (tags['building:levels']) return tags['building:levels'] * 3.3 + 1; // ~3.3 m per storey
  return estimateFromNeighbourhood();                                     // no data: make it plausible
}
How much of that is real data varies a lot by city. Around the Empire State Building, Big Ben and Warsaw’s Palace of Culture, 96–99% of buildings carry a height tag. Around Galata Tower almost none do, so there we give untagged buildings 4–7 storeys, which is typical for the area. Be honest about that if you publish the result.
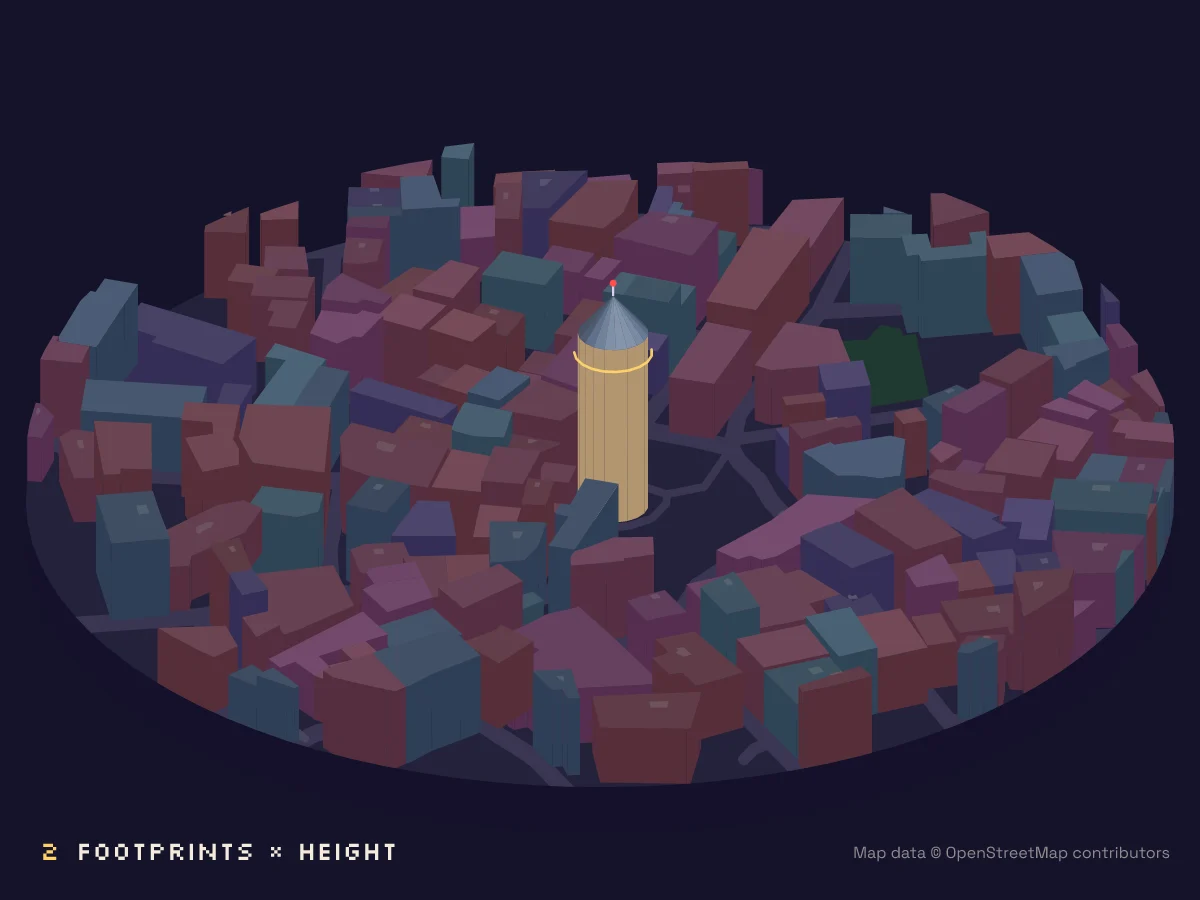
5. Draw only the walls you can see, and shade them
A wall is visible if its outward normal points towards the viewer. In our projection the viewer looks along (+1, +1) in ground space. With the footprint wound counter-clockwise, the outward normal of edge a → b is (dy, -dx):
for (const [a, b] of edges(footprint)) {
  const [du, dv] = [b[0] - a[0], b[1] - a[1]];
  const len = Math.hypot(du, dv);
  const [nu, nv] = [dv / len, -du / len];   // outward normal
  if (nu + nv <= 0) continue;               // faces away from the camera
  const light = Math.max(0, -(nu * L[0] + nv * L[1])); // L = light direction
  drawQuad(a, b, height, shade(baseColour, light));
}
That simple Lambert-style shading is what makes round towers like Galata read as cylinders: every facet of the polygon gets a slightly different brightness.
6. Get the drawing order right
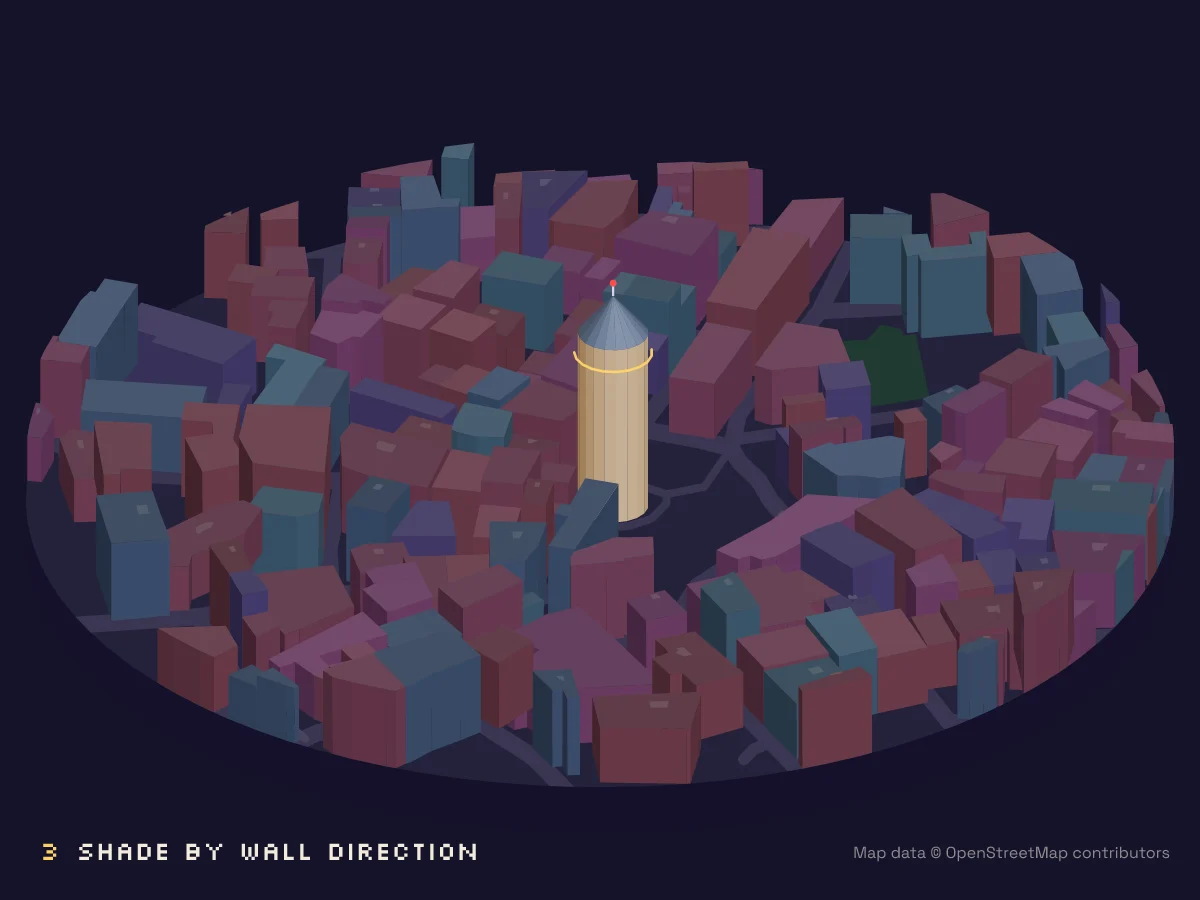
SVG has no depth buffer, so we use the painter’s algorithm: draw from back to front. In this projection “back” means a smaller u + v, so sorting buildings by the depth of their centroid works surprisingly well for ordinary city blocks.
It breaks down for complex landmarks, which OSM maps as several building:parts: a podium, a shaft and a spire stacked on top of each other. Two rules fixed it for us:
- If a building is split into parts, skip the outline and draw the parts.
- Sort parts by the depth of the outermost building that contains them, then by how deeply they’re nested, then by
min_height. Lower pieces of the same tower are drawn first.
Parts also have a min_height (where they start). Draw their walls from min_height to height, not from the ground.
7. Roofs, landmarks and real colours
Many towers have a tagged roof:shape and roof:height (Galata’s conical roof is pyramidal and 10.9 m). We approximate every non-flat roof as a pyramid rising to the centroid. It isn’t perfect for onion domes, but it’s recognisable.
Some landmarks also have real colours: building:colour and roof:colour. Stockholm City Hall’s brick tower and golden top come straight from the data. One catch: some mappers use pure primaries like blue as a placeholder for “glass”, which looks wrong at night. We ignore pure primaries and fall back to our own palette.
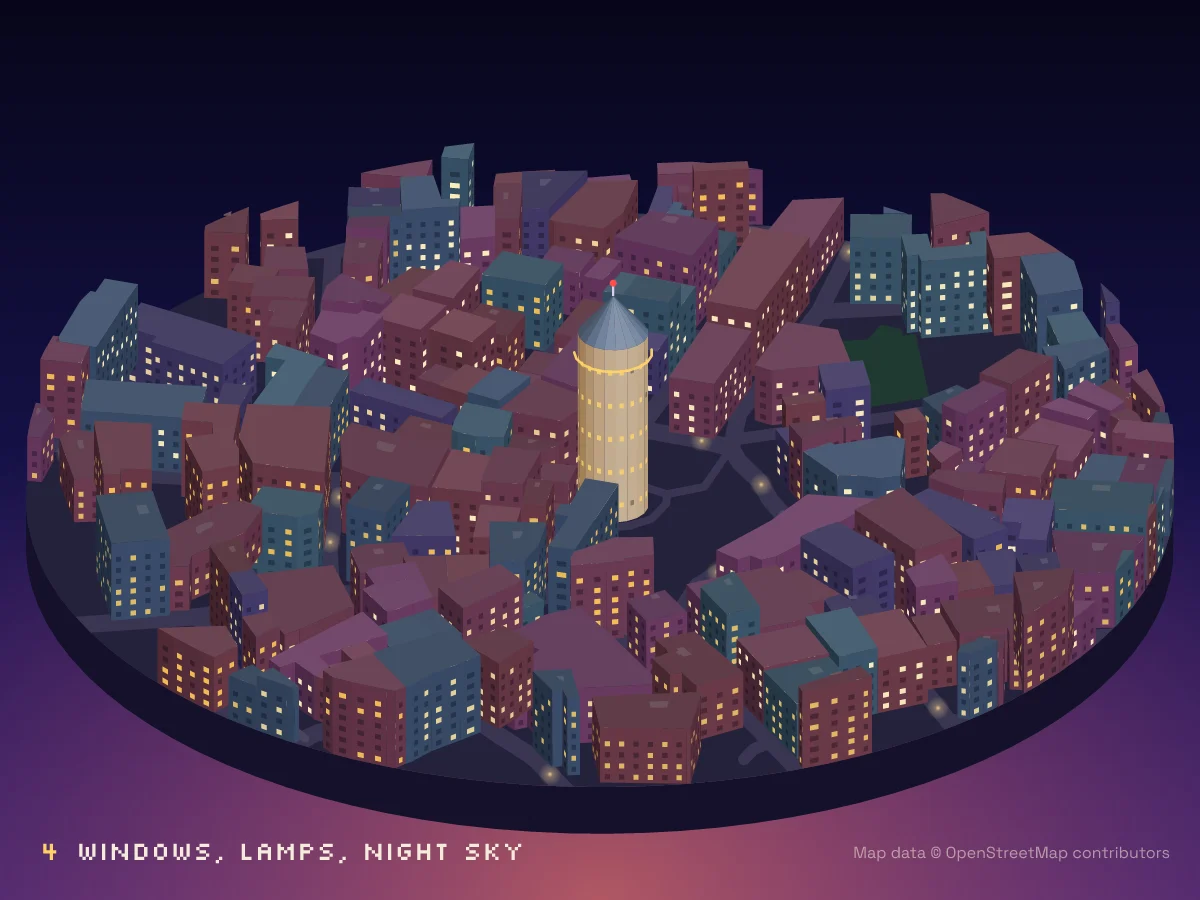
8. Night: lit windows and street lamps
For each visible wall, we lay out a grid of windows: one row per 3.3 m storey, one column per ~3.4 m of wall. About 40% are lit.
The important detail is how you pick them. If you call Math.random() while drawing, the pattern changes every time a different set of walls is visible, and an animation flickers like a strobe light. Hash the window’s identity instead:
const lit = hash(buildingId, wallIndex, floor, column) < 0.42; // same answer in every frameStreet lamps are radial gradients placed every ~22 m along streets wider than 5 m. Add a dark gradient sky and a moon, and it’s night.
9. The pixel-art finish
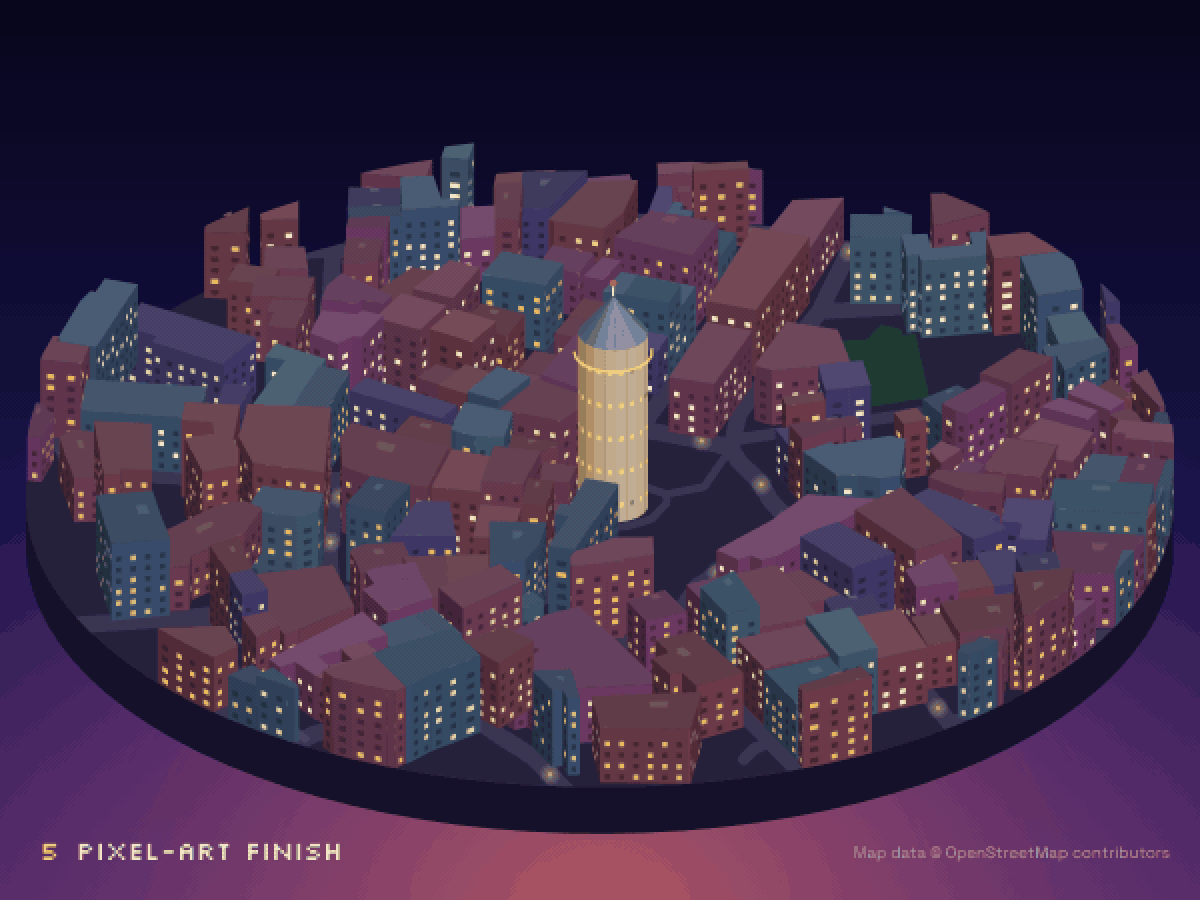
A vector render looks clean but not pixel. The trick is to render at full size, shrink it, reduce the palette, and scale it back up with nearest-neighbour sampling, so every “pixel” becomes a crisp 2×2 block. With ffmpeg:
ffmpeg -i scene.png -vf "scale=iw/2:ih/2:flags=area,split[a][b];\
[a]palettegen=max_colors=128[p];[b][p]paletteuse=dither=bayer:bayer_scale=5,\
scale=iw*2:ih*2:flags=neighbor" scene-pixel.png
A 3× reduction gives chunkier pixels. We found 2× with a 128-colour palette kept small details like Galata’s balcony readable.
10. Bonus: make it move
Because everything is deterministic, animation is just a loop: for each frame, change the camera angle and zoom a little, render a PNG, then let ffmpeg stitch the frames into an MP4. A slow 70° orbit with a gentle push-in over 15 seconds makes a nice vertical video.
Gotchas we hit
| Problem | What happened | Fix |
|---|---|---|
| Missing heights | Most of Galata has no height tags | Plausible estimates, and say so |
| Floating towers | A skyscraper’s top section was mapped but its lower floors weren’t | If nothing is underneath a part, extend it to the ground |
| Missing spire | The Empire State’s mast is a part that is only roof (height = min_height) | Keep roof-only parts |
| Fake colours | building:colour=blue on a glass tower |
Ignore pure primary colours |
| Black buildings | Our rasteriser silently failed on fractional HSL hues like hsl(201.5 …) |
Round hues to integers |
| Flickering windows | Random choice per frame | Hash per window |
Licensing
OpenStreetMap data is © OpenStreetMap contributors and available under the Open Database License. You can publish renders like these, but credit “© OpenStreetMap contributors” visibly. We put it on every image and video.
Want a whole city?
Rendering a neighbourhood is one thing. The makers in our directory have done entire cities, most of them with AI-drawn tiles. Explore them all on the world map, read about the other techniques in our guide to making an isometric city map, or see what an isometric map actually is.
Built one yourself? Submit it and we’ll put it on the map.